
Measuring Load with a Raspberry Pi
Valuable Data Enhances Competitive Design and Performance
Author: Tyler McLaughlin – Suspension Design Lead.
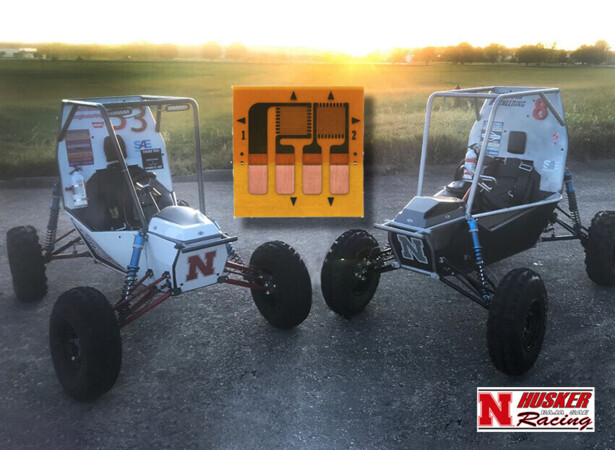
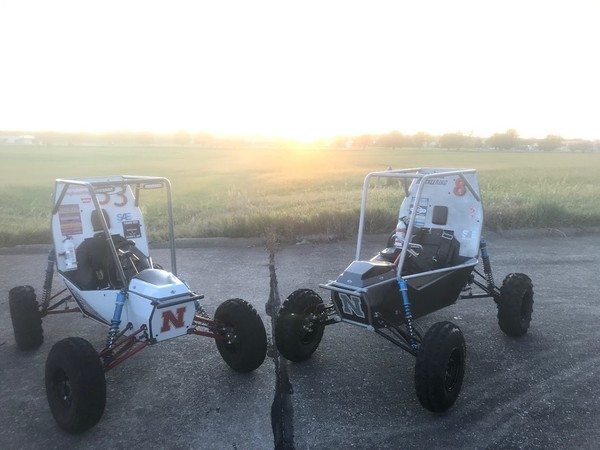
SAE (Society of Automotive Engineers) is a global organization providing opportunities for students through the collegiate design series. The goal of Baja SAE is to design a one person off-road vehicle with maximum durability and minimum cost. Teams compete in design, sales, and dynamic events including a four-hour endurance race designed to push the car to its limits. The goal of this study is to record the strain experienced by suspension components during the endurance race.
Company/Institute: Husker Racing Baja SAE; University of Nebraska-Lincoln
Industry/Application Area: Stress Measurement (Automotive/Suspension)
PRODUCT USED:
- Gage Application Kit: GAK-2-200
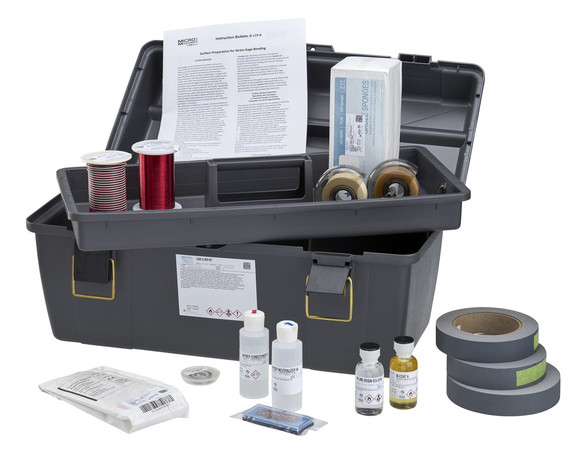
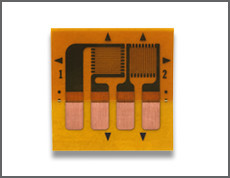
- Tee Rosette Gauge: CEA-06-062UTA-350 (Advanced Sensors Technology)

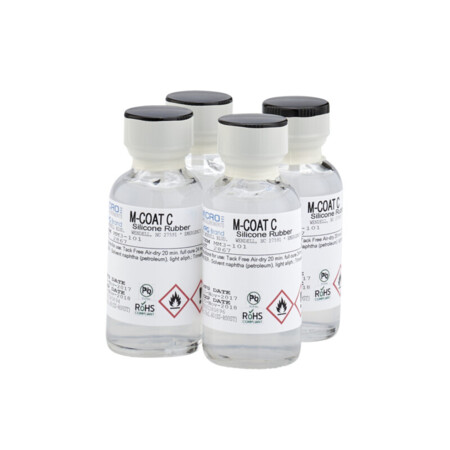
- RTV Silicone Rubber: M-Coat C
CASE STUDY:
Each year, Husker Racing designs a new car based on data and observations collected from the previous year. Strain gauges allow us to dynamically test our suspension components under our normal driving conditions. The challenge was to implement strain gauges with an onboard data acquisition system to determine the loadings seen by the suspension linkages. The collected data would allow us to investigate lighter materials to be used in our suspension components.
To goal of this study was to prove that carbon fiber can withstand the loadings seen in car control links (as shown in Figure 1). The control link is mounted on both ends by spherical bearings to ensure that the only loads measured are axial tension and compression.
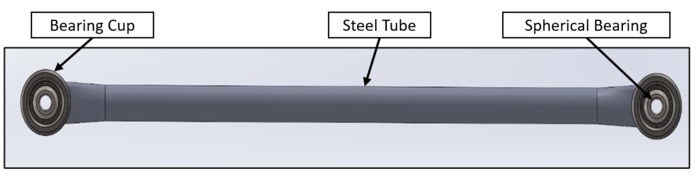
Figure 1: 2019 Steel Control Link
THE SOLUTION:
The key to acquiring accurate data under normal driving conditions was to measure strain using the tee rosette strain gauges provided by Micro-Measurements.
Tee rosette strain gauges were selected to allow for easier application of a full Wheatstone bridge.
The strain gauge sensors were applied on opposite sides of the tube and wired to eliminate bending (as shown in Figure 2). This setup results in measuring only the axial load.
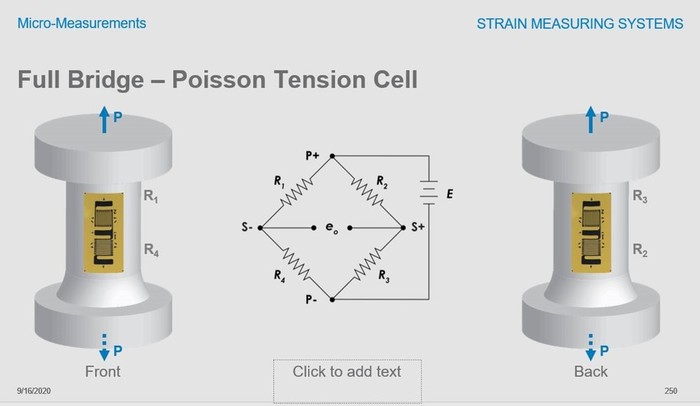
Figure 2: Strain Gauge Configuration
The strain gauges were connected to an HX711 board to amplify the output signal in order to convert from analog to digital. The strain gauges and connections are shown in Figure 3.

Figure 3: HX711 Board and Connections
To record the data under normal driving conditions, a Raspberry Pi was fitted to the hood of the car with a touchscreen (as shown in Figure 4). This configuration allowed the system to be both easily contained within the car and controlled by the driver. The system did not require any connections (wired or wireless) outside of the car.
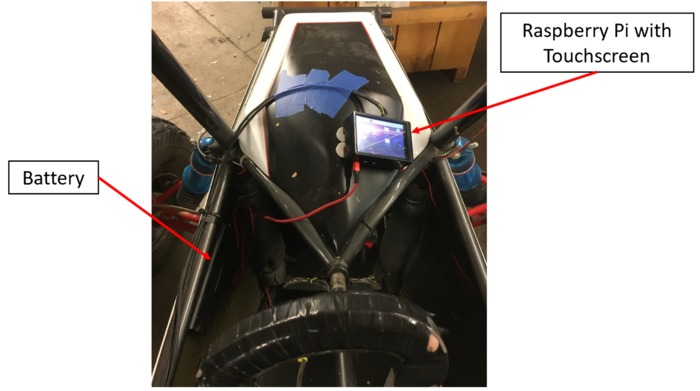
Figure 4: Testing System Setup on Car
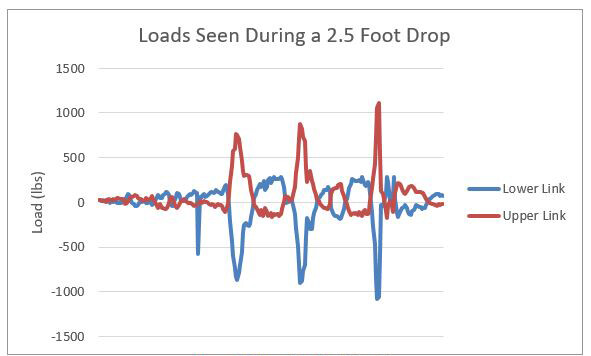
After setup and calibration, the car was driven through several tests to simulate normal driving conditions. These included jumps, drifting, obstacle collision, and a drop test. The highest loads were seen during the drop test. For this test, the car and driver were raised from the front right corner of the roll cage until the left rear wheel was 2.5 feet off the ground. This positioned the car so that the left wheel (with the strain gauges) would make ground contact first with side loading. The goal of this test was to simulate a rollover incident.
The chart in Figure 5 illustrates the data collected during the drop test. The highest peak of 1109 lbs. in tension was seen by the upper link. The highest peak of 1,078 lbs. in compression was seen by the lower link. In this graph, tension is shown as positive while compression is negative.
THE USER EXPLAINS:
The Husker Racing carbon fiber control link design (shown in Figure 6) was based on a similar design used by Husker Motorsports Formula SAE for various applications. The goal of testing the control links was to prove that this design can withstand the conditions of the Baja car.
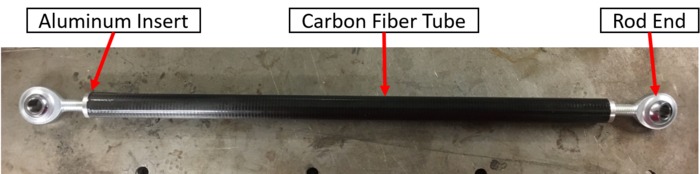
Figure 6: 2021 Carbon Fiber Control Link
Based on the design in Figure 6, the control link should fail at the epoxy joint between the aluminum insert and the carbon fiber tube. This joint should theoretically yield at 2,925 lbs. Figure 5 demonstrates that (based on data collected during the drop test) the largest load in tension was 1,109 lbs. with a safety factor of 2.64 for the carbon control link.
This information proves that the carbon fiber control link can withstand the loadings seen by the Baja car control links.
“Strain gauges allow us to advance our team forward in competition by using modern technology to study and redesign components.”
ACKNOWLEDGEMENT:
Husker Racing would like to thank Mike Wadner, Paul Millard, and Micro-Measurements for their support and guidance.
Their support has allowed us to collect valuable data for our design competition as well as gain skills and knowledge to help us compete in years to come.
Tyler McLaughlin
Suspension Lead
Husker Racing Baja SAE/University of Nebraska-Lincoln
Get the Competitive Edge with VPG Design and Performance Data. Visit micro-measurements.com
Connect with a Measurement Expert at https://micro-measurements.com/contact
Michael Wadner
Micro-Measurements USA


Recent comments